
Explore Petaluma through mapping and data visualization!
The following maps were generated in 2020 to establish the current conditions in Petaluma and have played a key role in creating the General Plan Update.

Base Map

Regional Context

General Plan Land Use

Zoning

Planning Boundaries

General Plan 2008 Planning Sub Areas

Area Plans

Population Density by Census Block Group

Population Density by Units per Parcel

Ethnicity

Language Spoken

Median Population Age

Income per Capita

Educational Attainment

Commute Time to Work

CalEnviroScreen

Urban Displacement Project Typology

Major Employers

Historical Landmarks and Districts
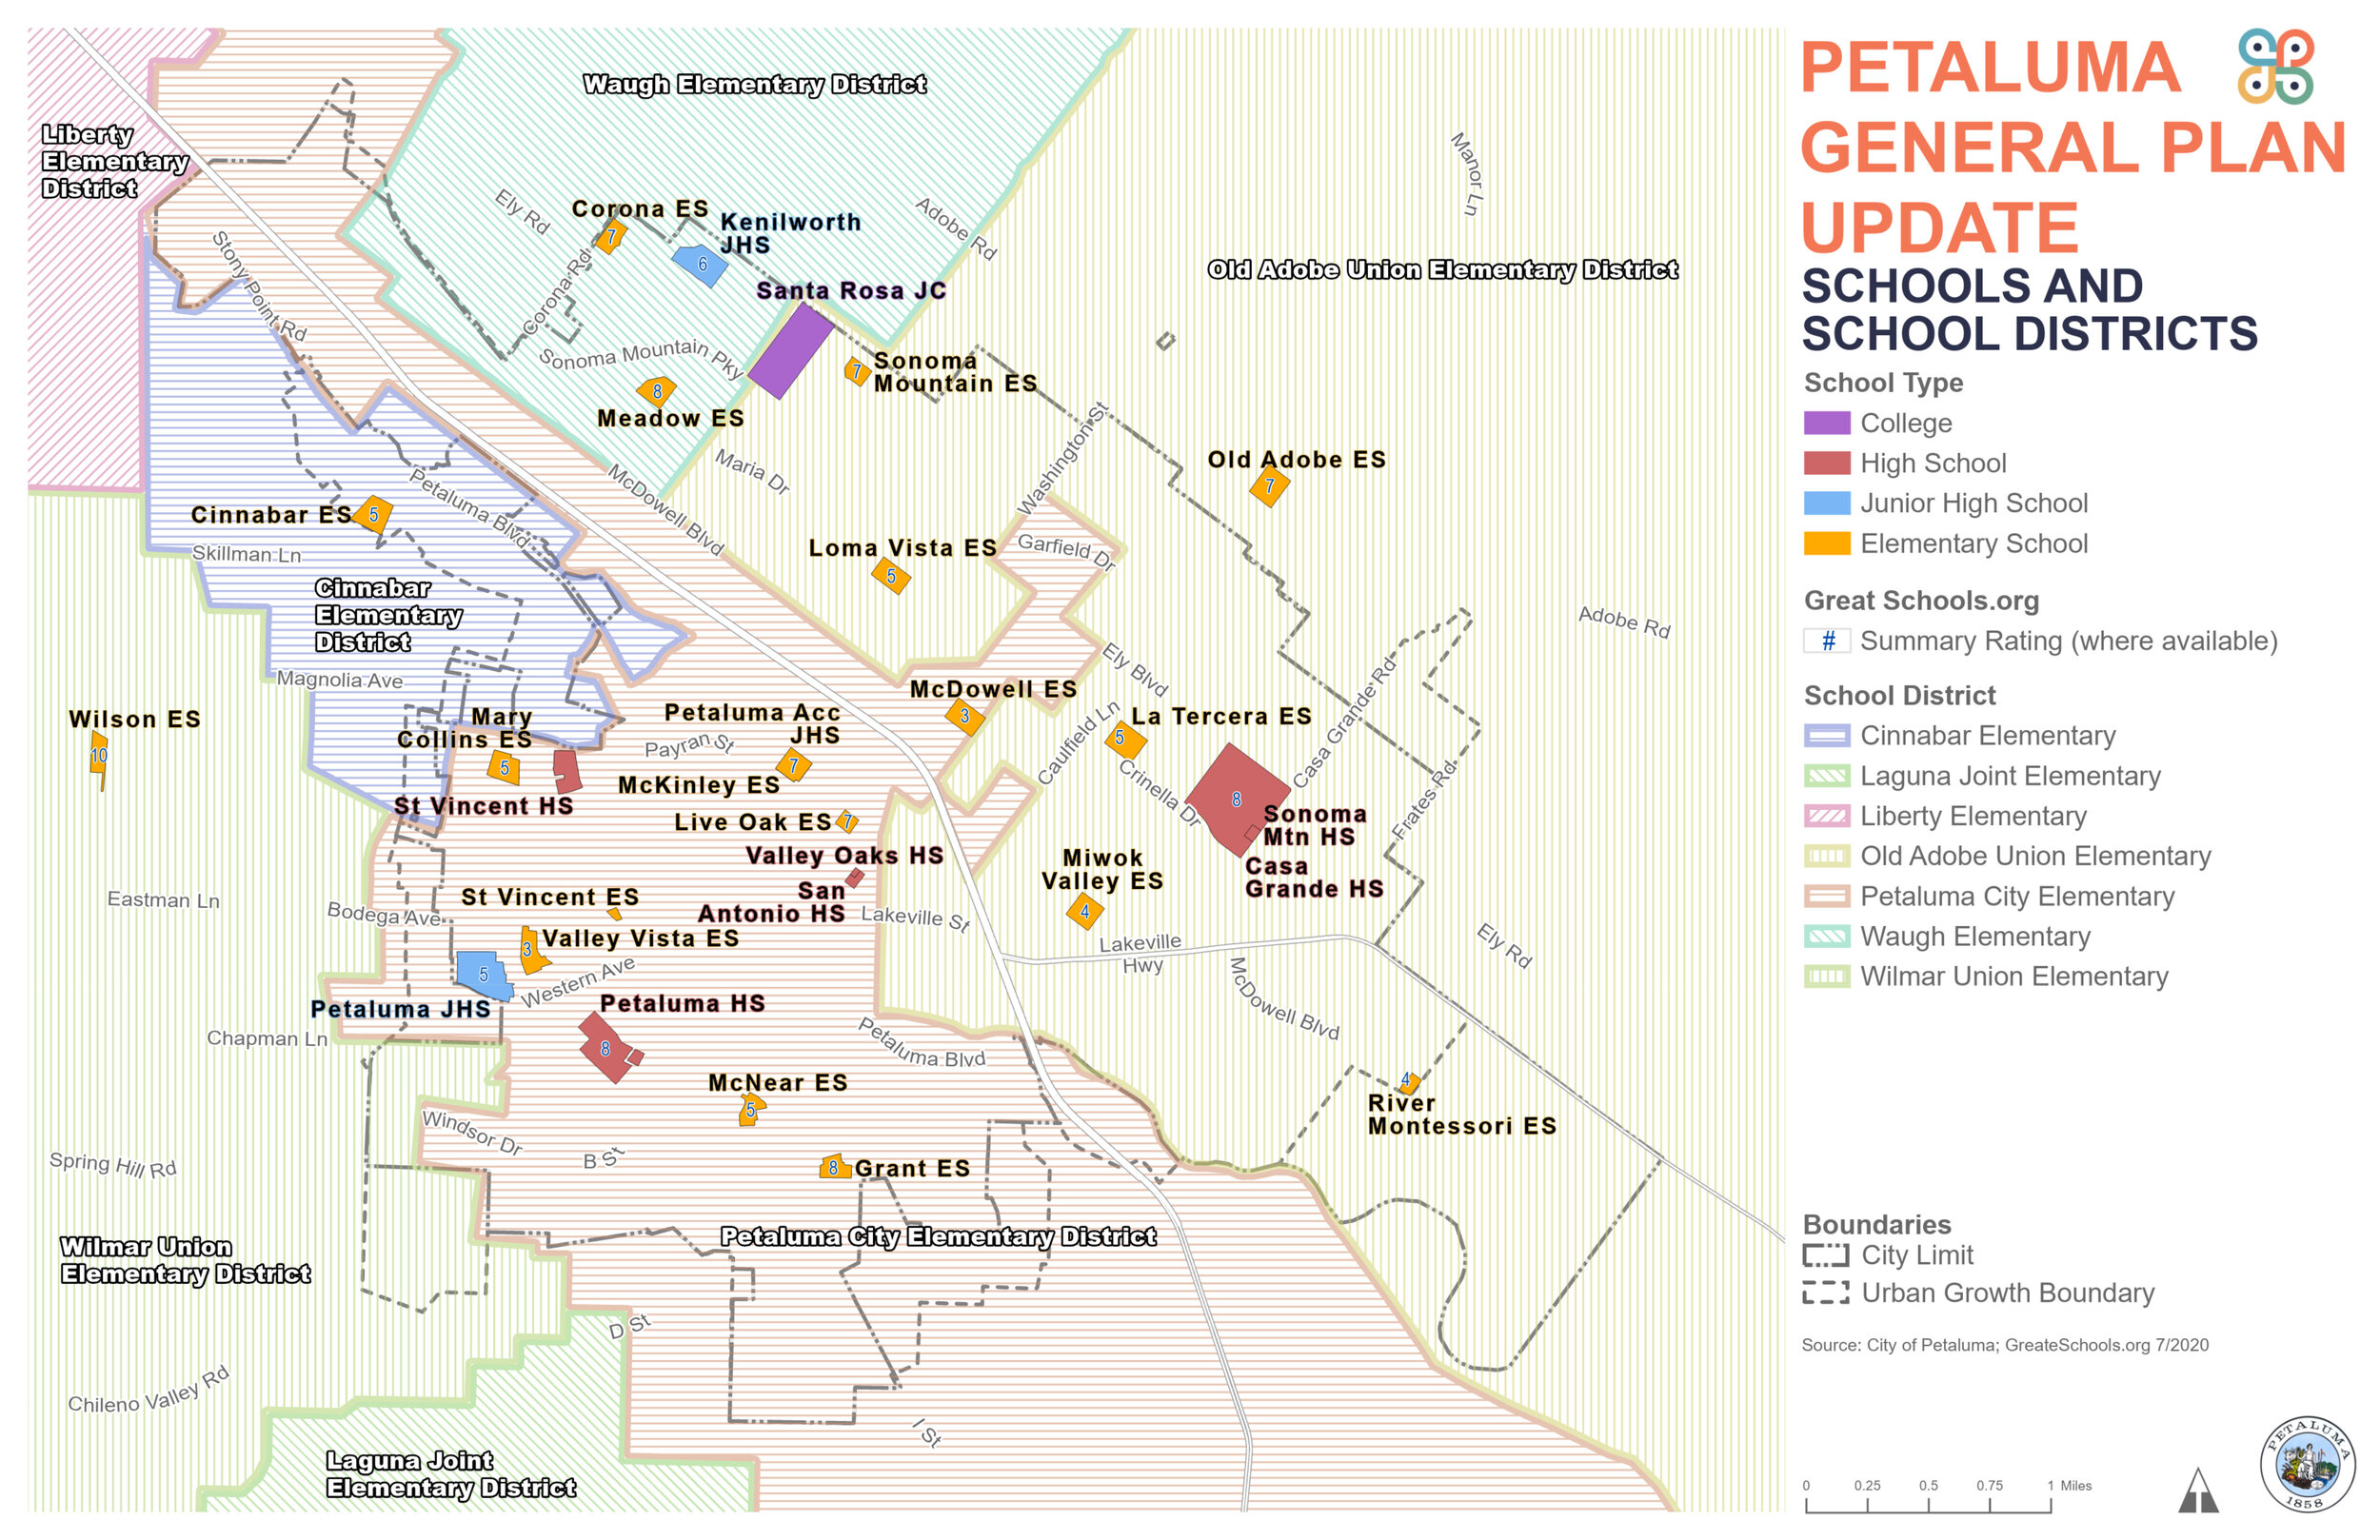
Schools and School Districts

Safe Routes to School

Public Facilities and Properties

Parks and Open Space

Parks and Open Space Access

Regional Trails

Multi-Use Facilities

Street Class

Public Transit

Noise Contours

Airport

Creeks

Preliminary Sea Level Rise 2 feet citywide, data from Adapting to Rising Tides. City is working to identify best practices for Sea Level Rise mapping.

Preliminary Sea Level Rise 2 feet downtown, projected high level mark by 2050 data from Adapting to Rising Tides. City is working to identify best practices for Sea Level Rise mapping.

Preliminary Sea Level Rise 4 feet citywide, data from Adapting to Rising Tides. City is working to identify best practices for Sea Level Rise mapping.

Urban Greening priority areas exist where there are overlapping layers of higher daytime population density, greater land surface temperature, air pollution exposure, lack of urban tree canopy, and high degree of imperviousness

Topography

Prime Agricultural Land and Farmland

Historical Ecology

Major Habitats

Priority Habitats

Wildlife Corridors

Occurrences of Sensitive Species

Endangered and Threatened Species

Wildland Urban Interface Fire Risk

Wildfire Hazards and Responsibility Areas
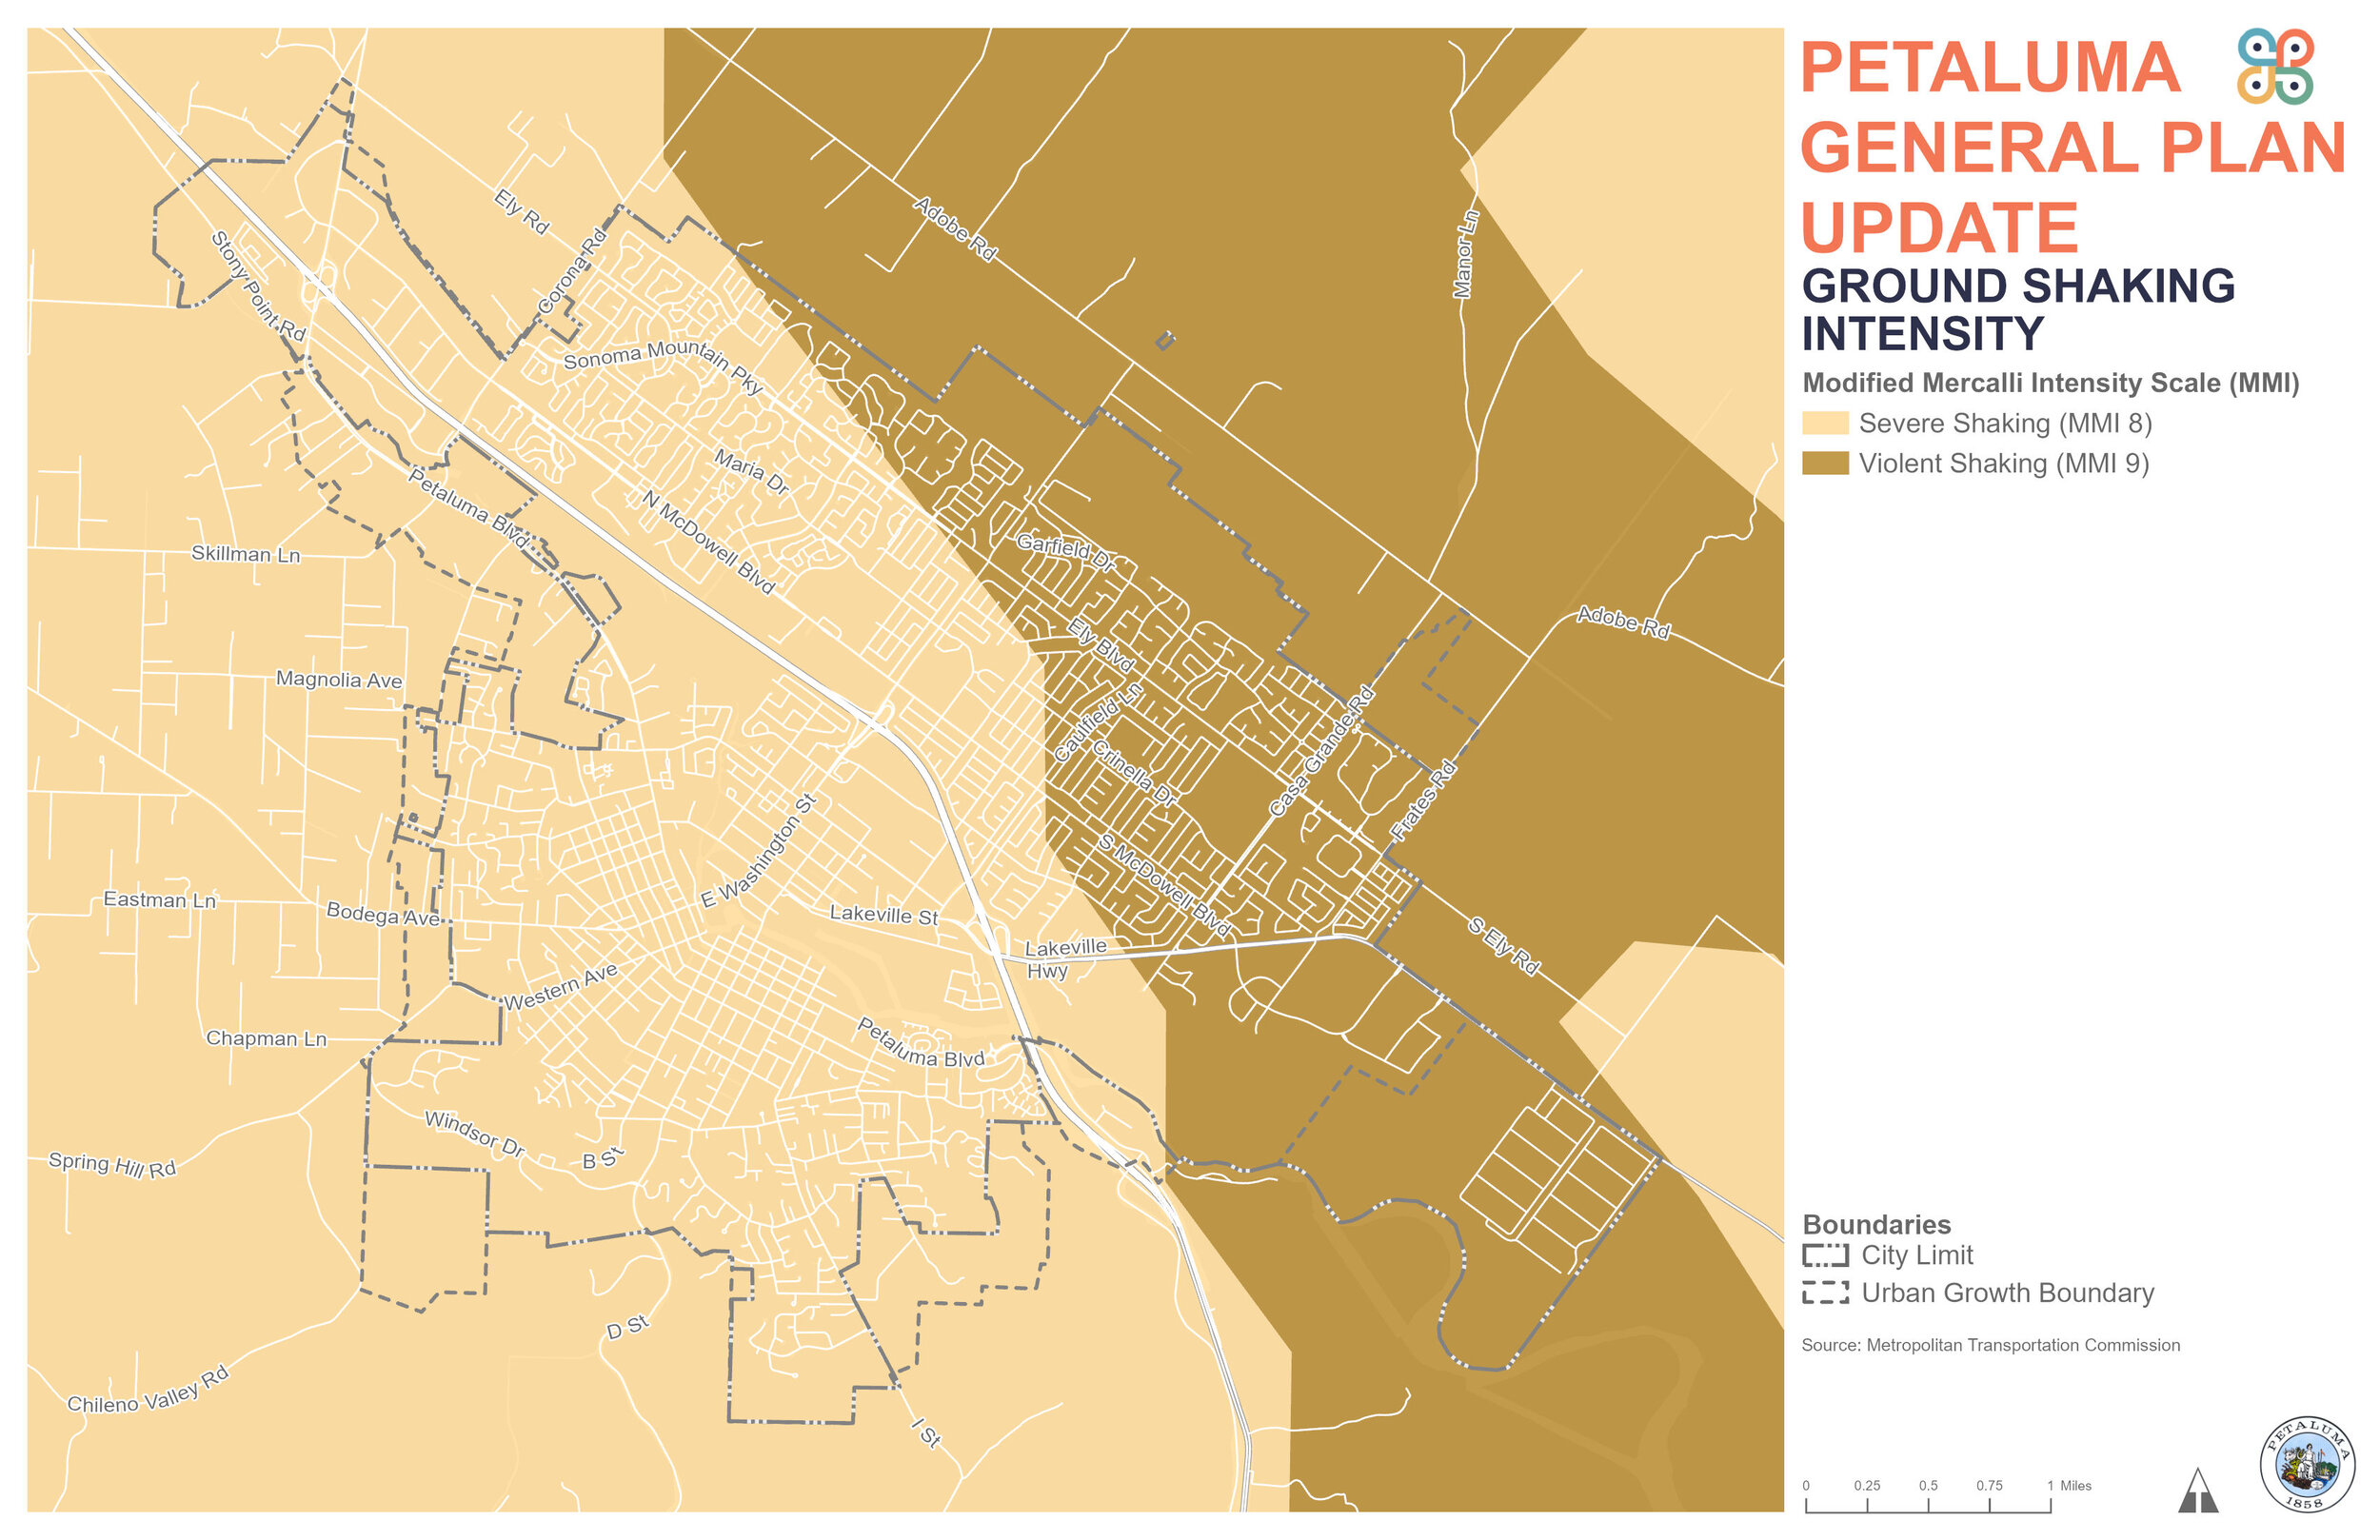
Ground Shaking Intensity

Geologic Hazards

Ground Pollution Sites